Using tables for statistics
When to use
There is a large amount of structured data to be displayed;
Complex behaviors such as sorting data, making simple charts, exporting files such are required.
Display
Data processing
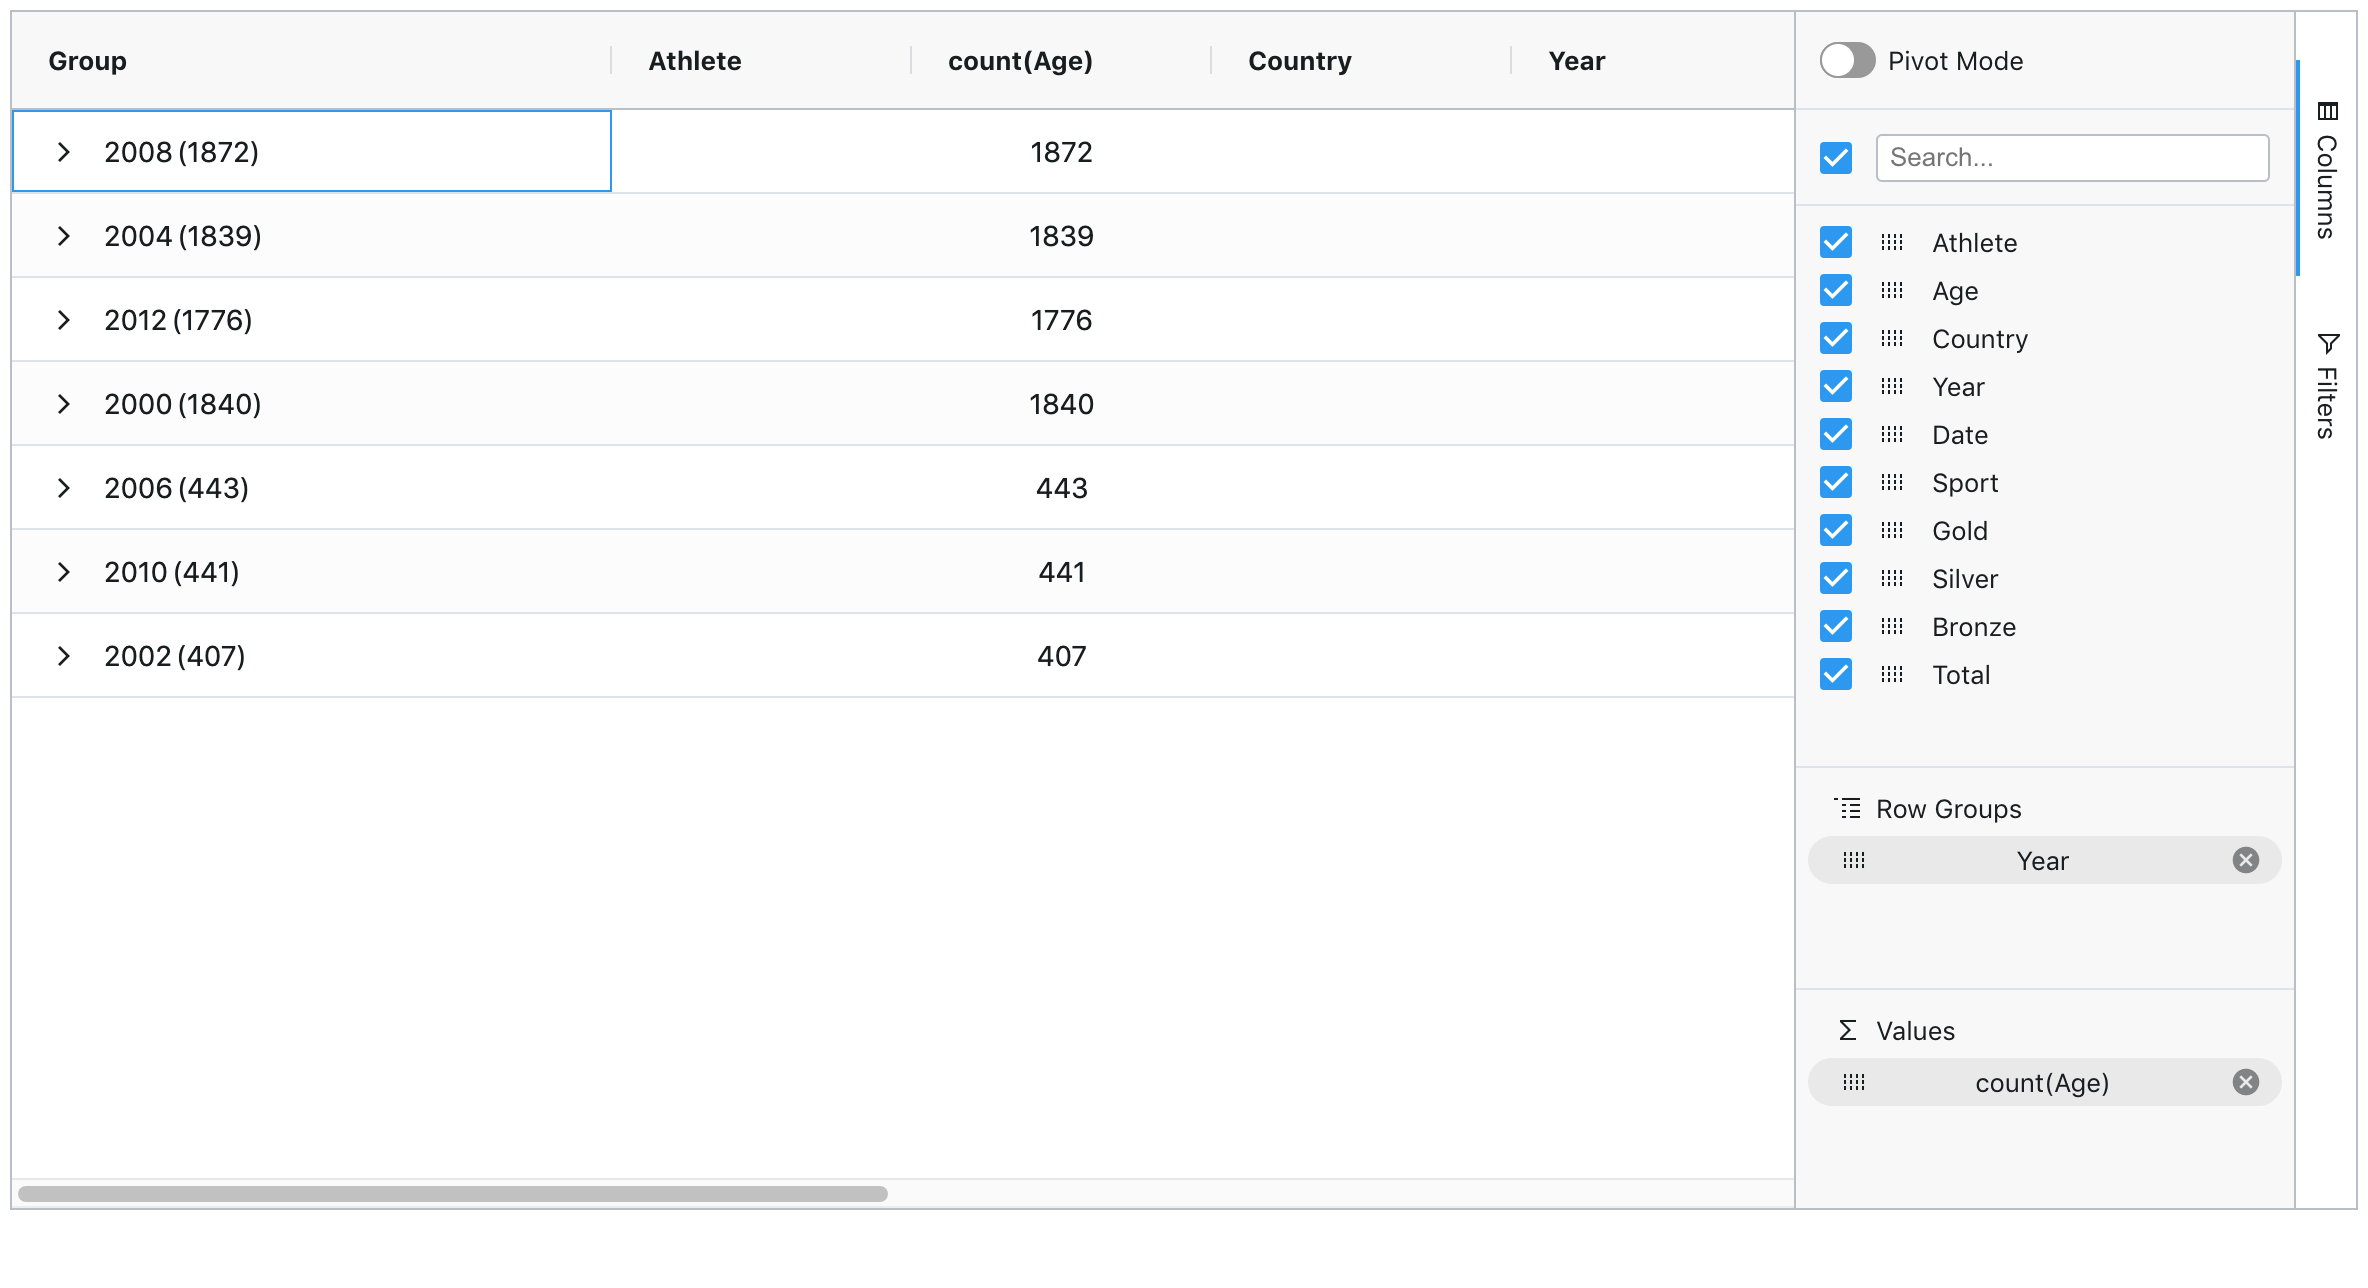
Data sorting is the most common way we deal with tables.
First, the mouse click on the current column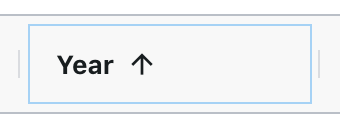 then, the table can be sorted by the current column value;
Additionally, when clicking over the current column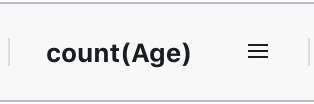 click the menu button:
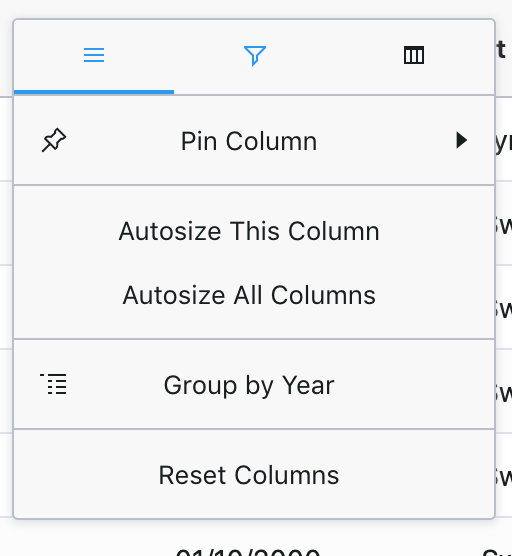
- The functions of left button are fixing columns, adjusting column width, and grouping by current column.
- The function of the middle button is to filter the data of the current column.
- The function of the button on the right shows or hides the specified column for the current table.
Make simple diagrams
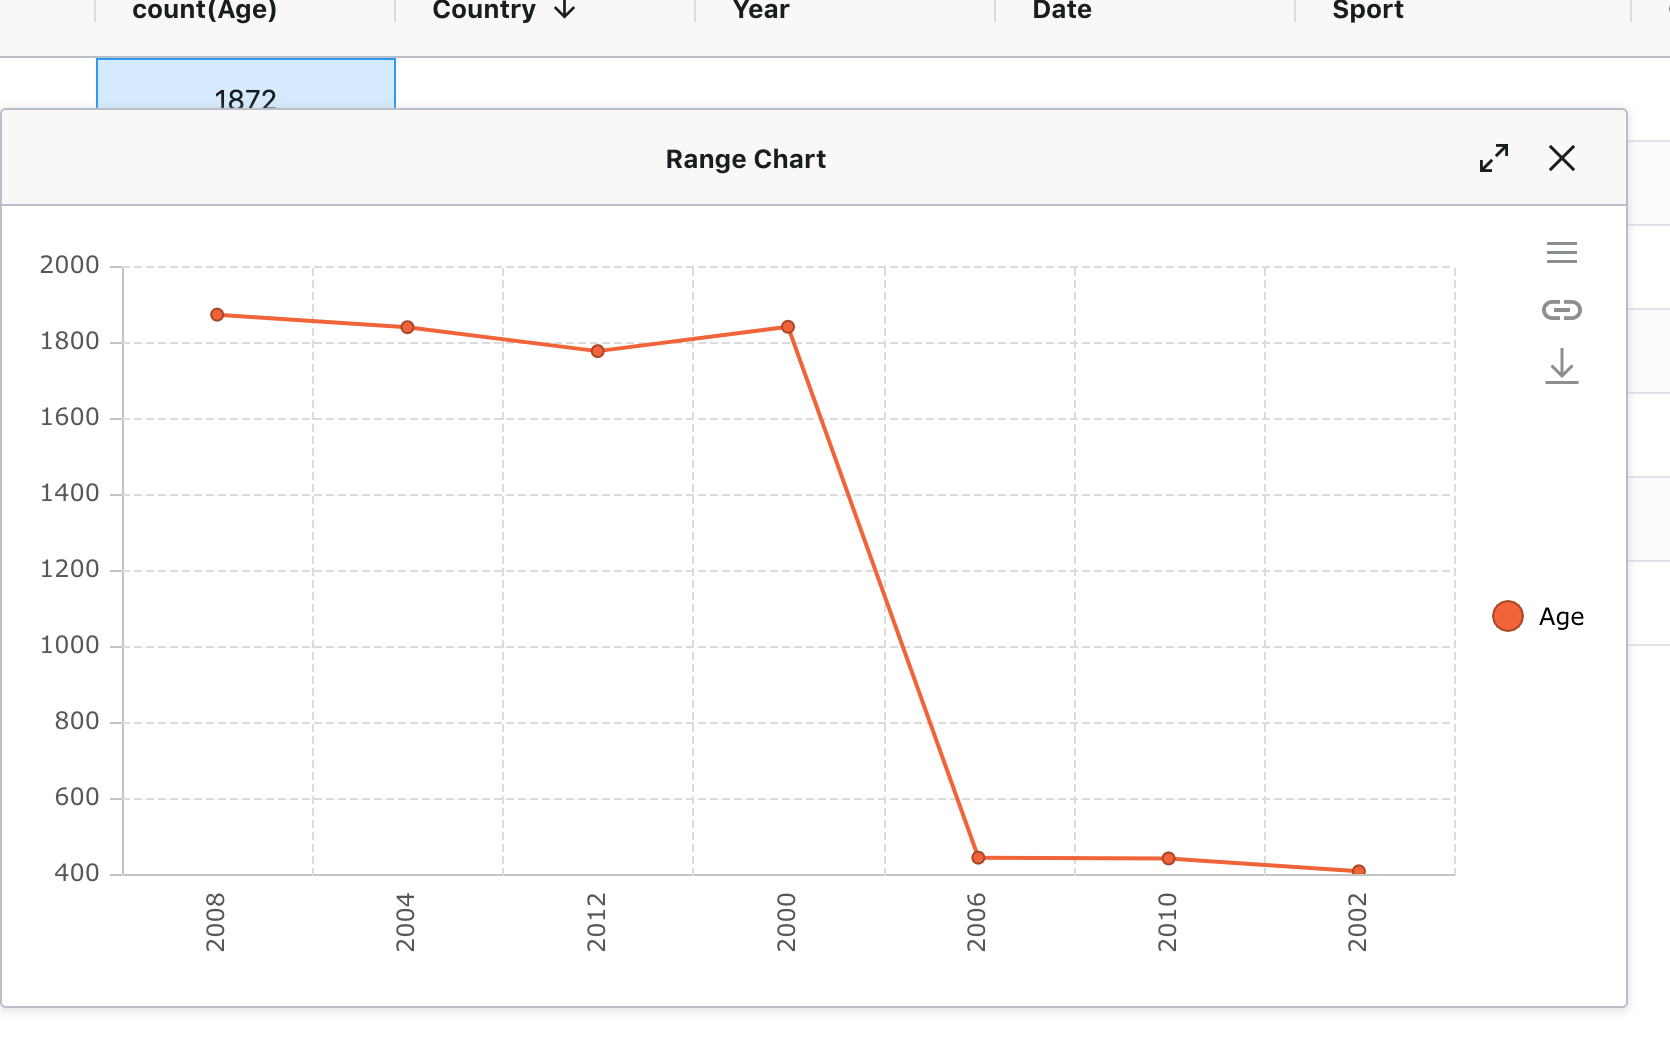
The chart allows us to see the database more intuitively.
Press the mouse left button to select the data we need:
Right-click on the selected place to select the type of table we need to specify, and the user can select the appropriate chart for analysis according to the data itself.
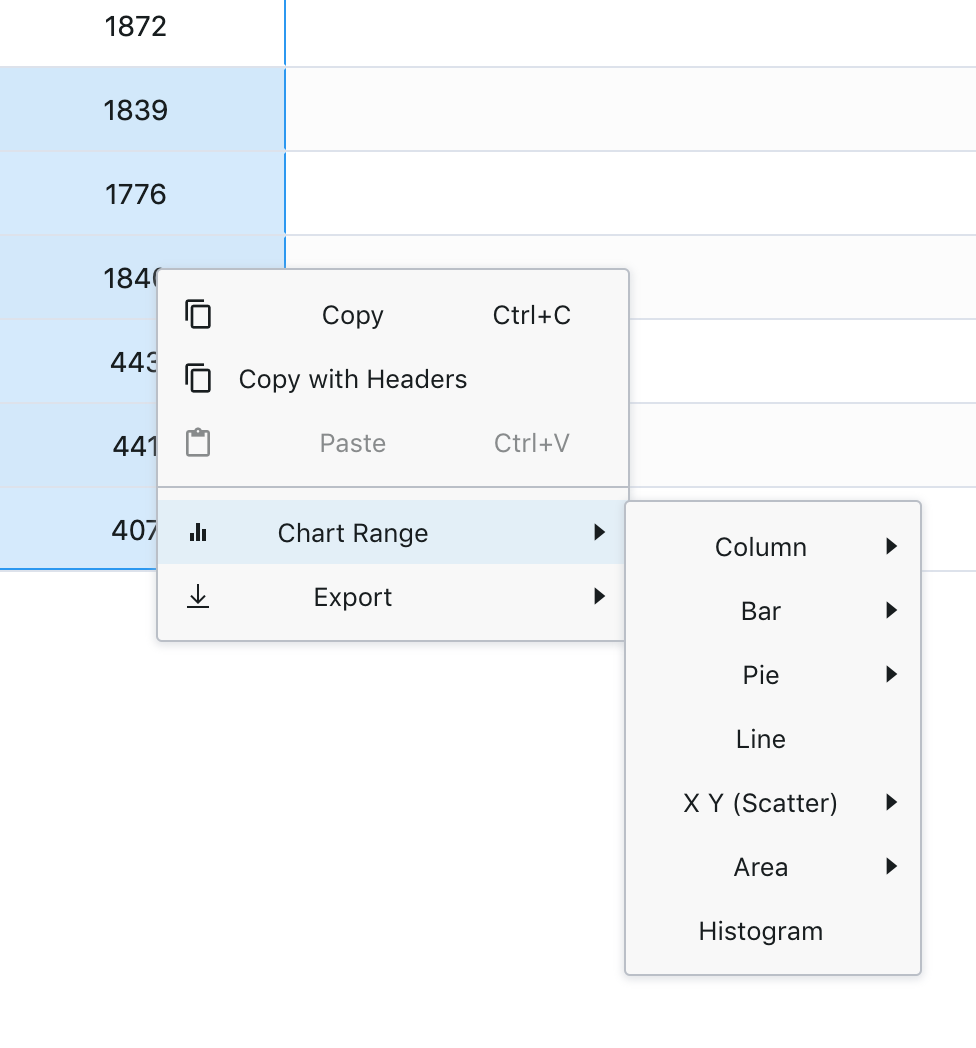
Like : Line chart to analyze
Data export
Support excel, csv data export.
The method is similar to making a simple chart. Click Export to select the appropriate type to export the file.
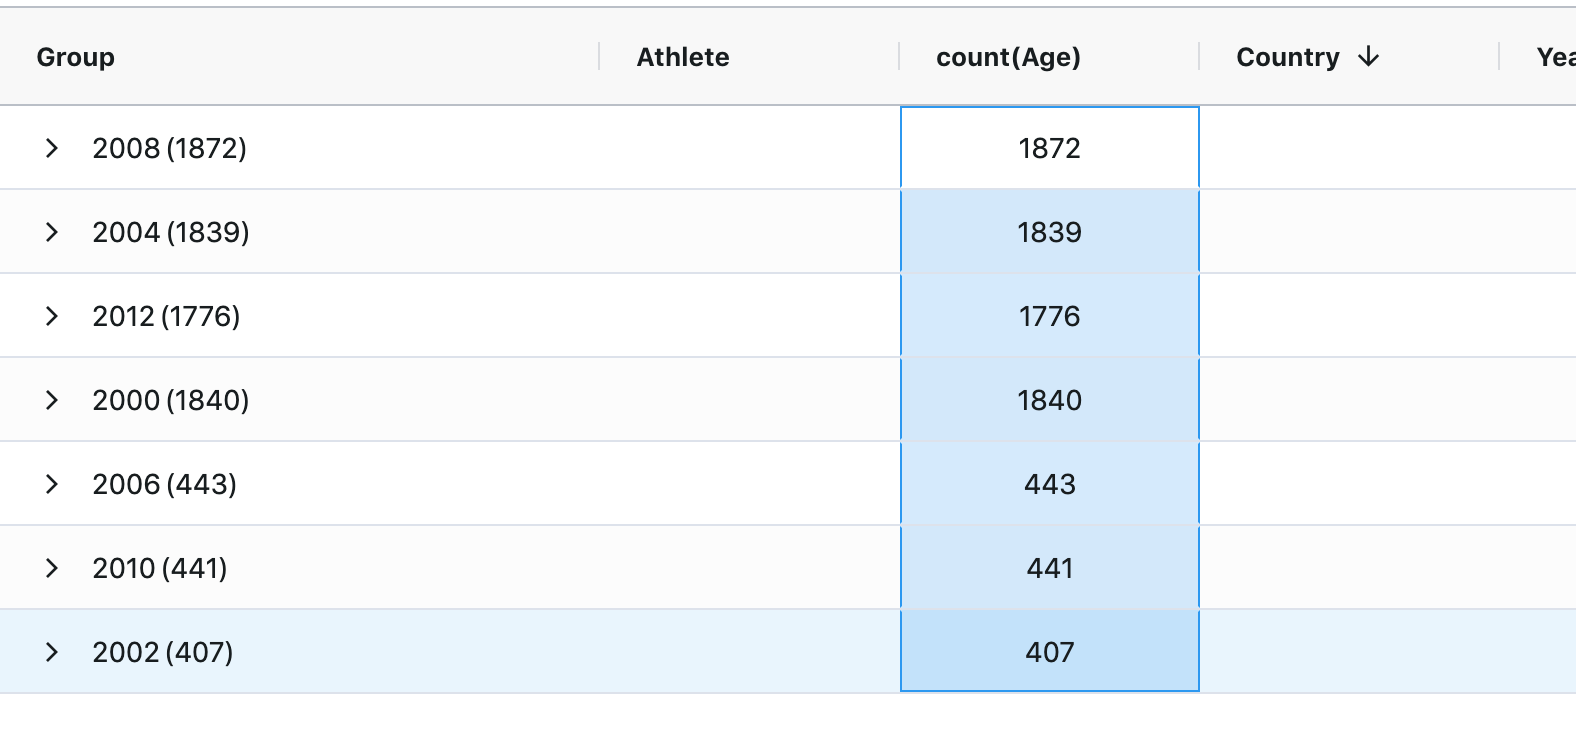
Aggregation of charts
Built-in functions: sum,min,max,count,avg,first,last。
Click the menu on the right of the table->Columns
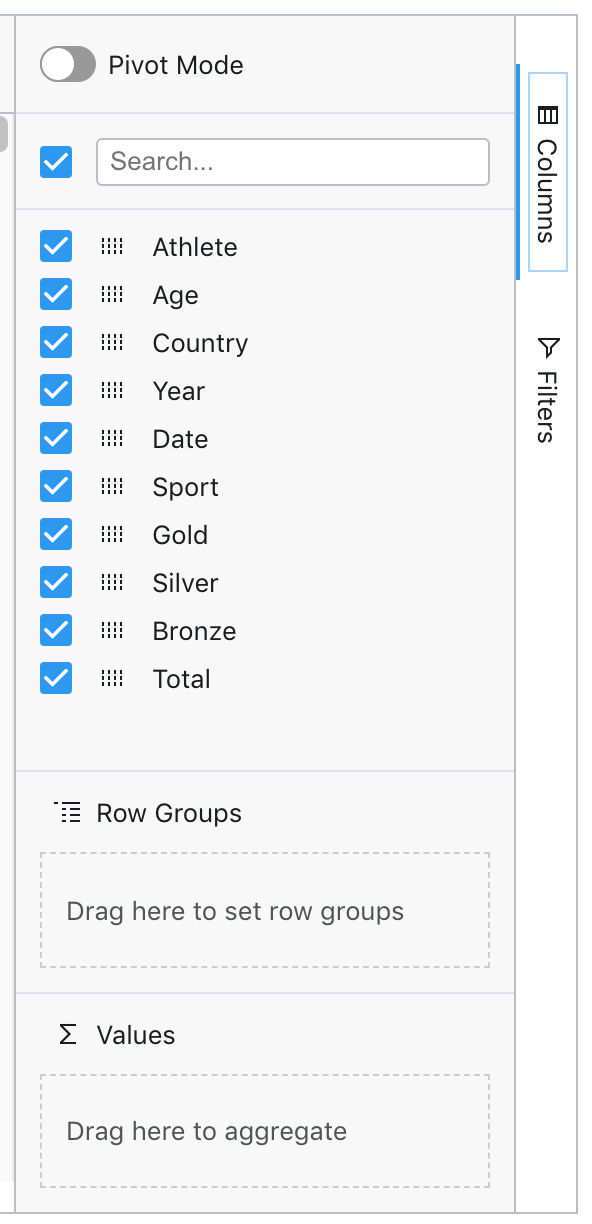
Drag the column name to Row Groups to use the current column for data grouping;
Drag the column name to Values and click the corresponding function method to aggregate the data.